Projects
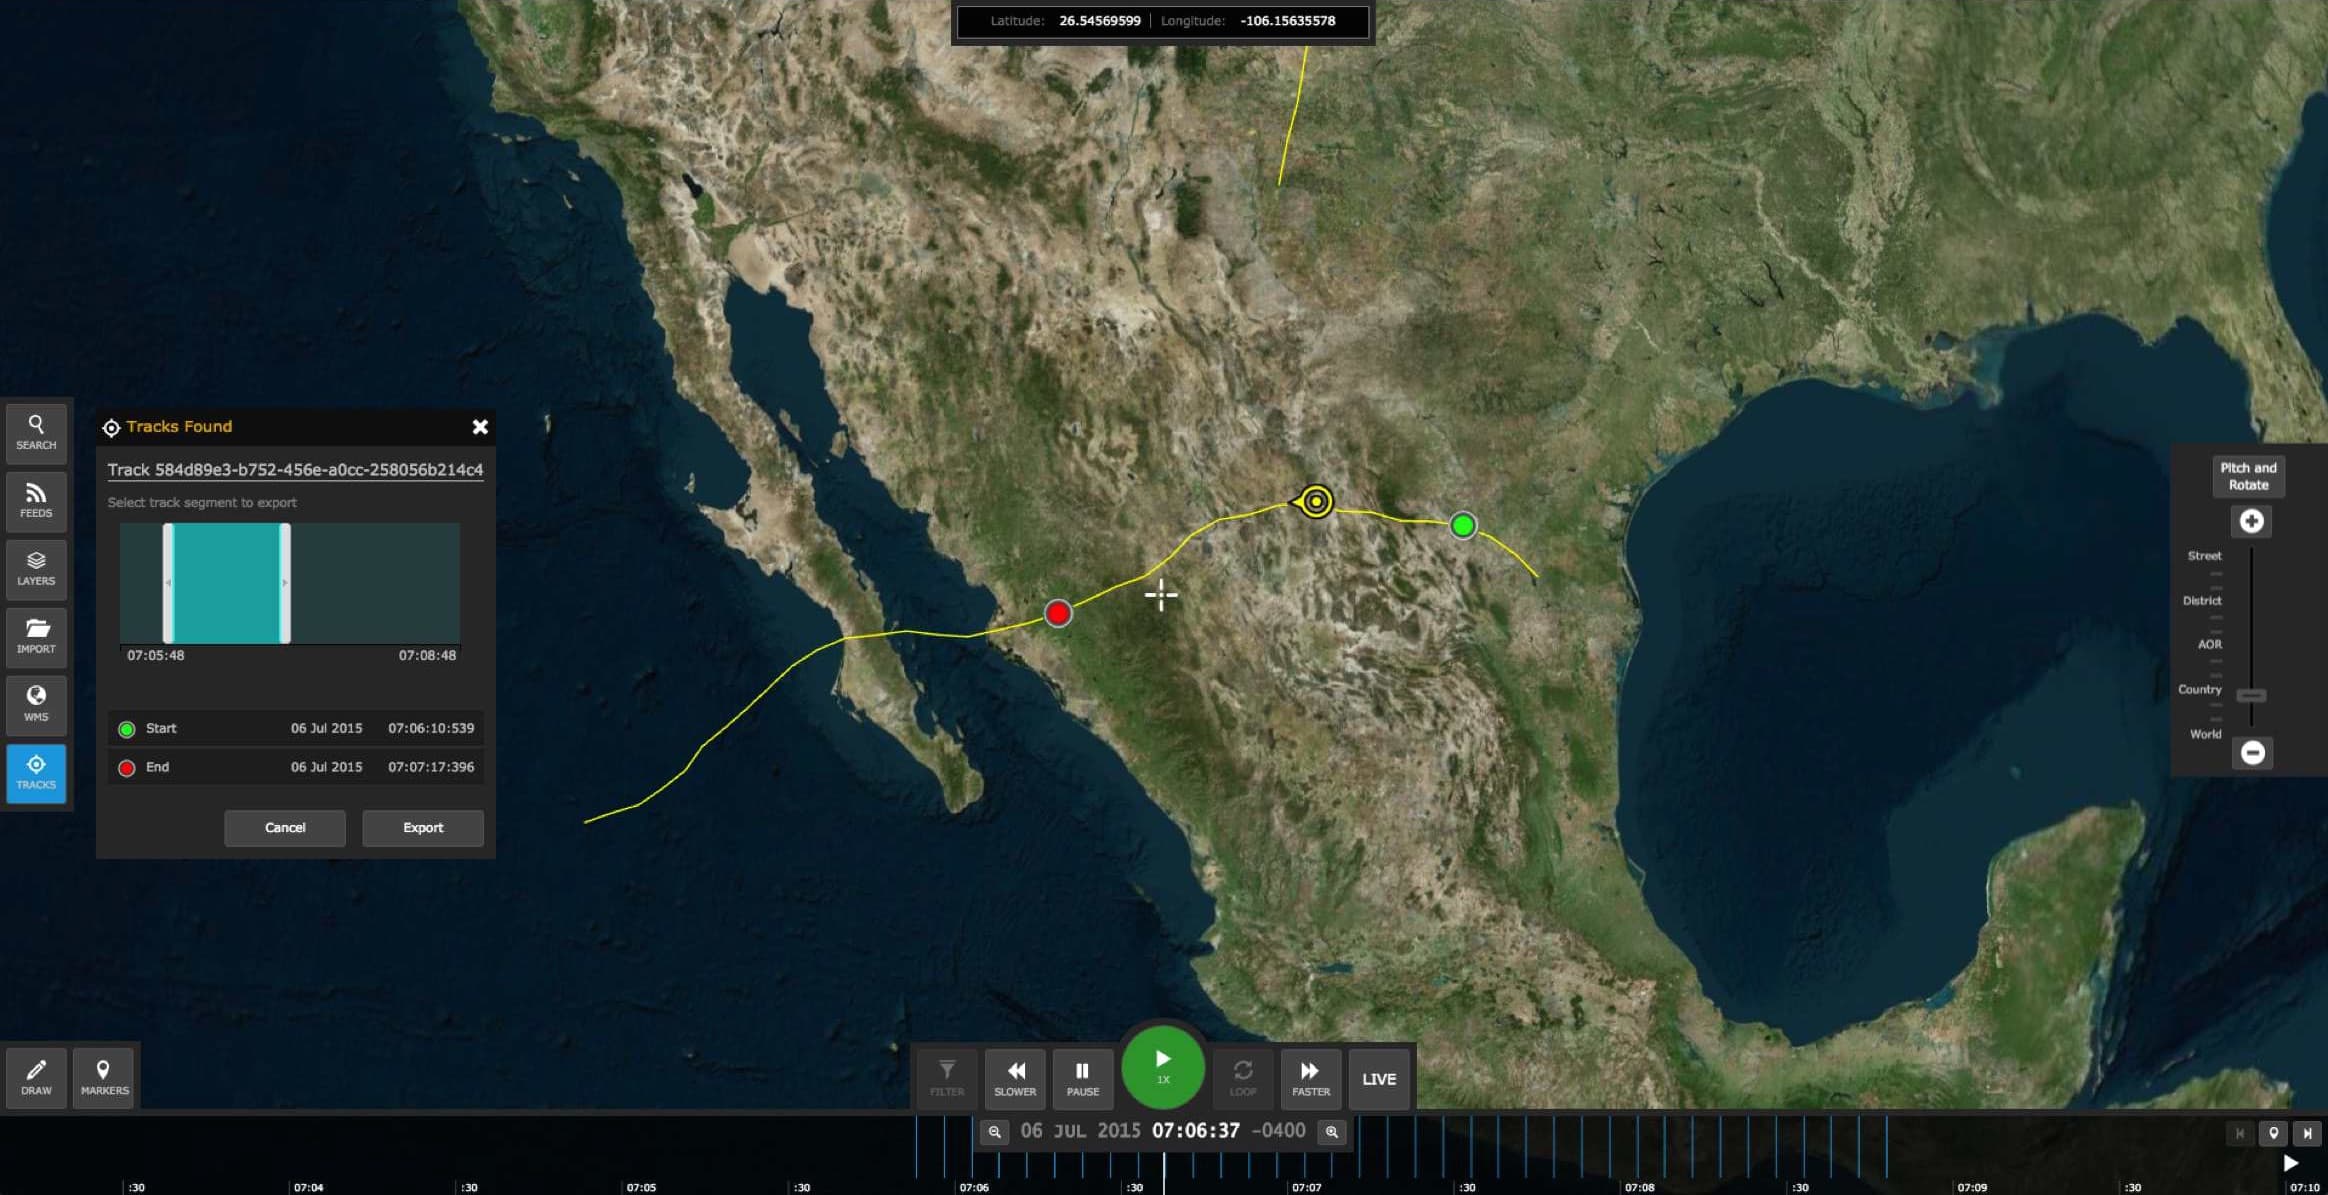
Replay Web
Replay allowed users to visualize and replay geo-temporal data on a 3d globe through a web browser
Learn more →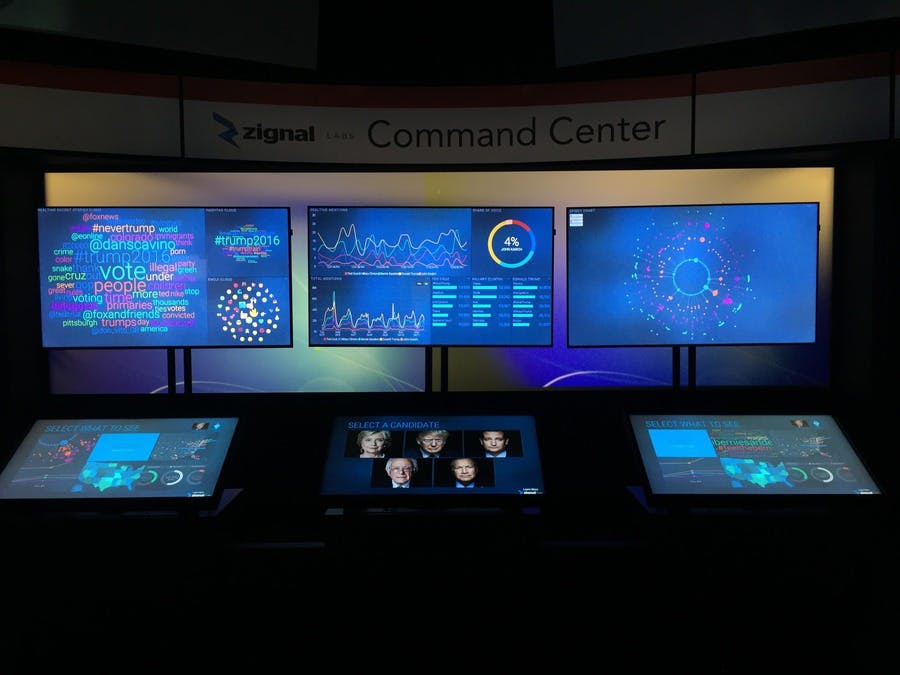
Zignal Command Center
Over 4-5 weeks, an interactive exhibit at the Newseum was created to allow users to control the Zignal Command Center to visualize and monitor real-time social media trends
Learn more →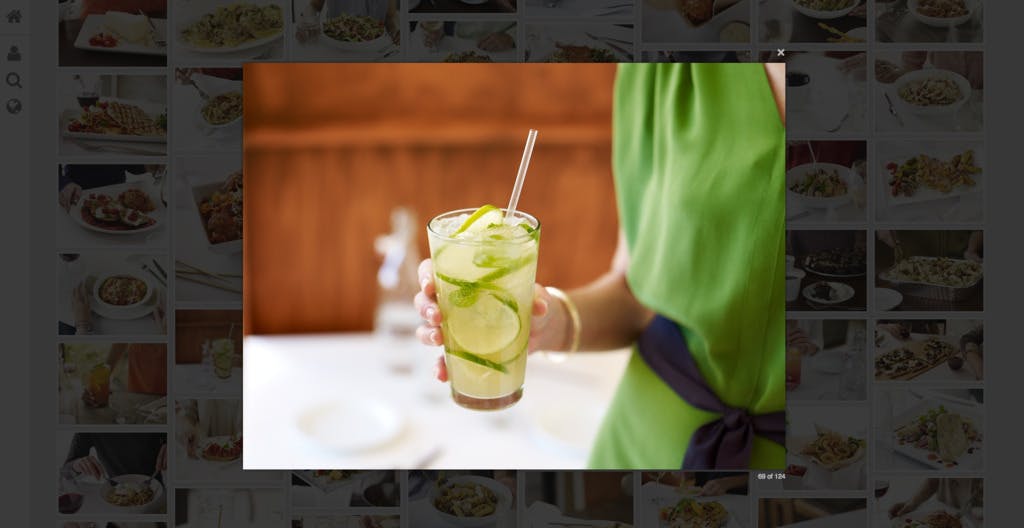
Food Time
Food Time took a visual approach by searching menu items based on filters through a infinite scroll masonry layout
Learn more →
Photos
A project to performantly serve high-resolution images in responsive image galleries with perfect grids and lightboxes
Learn more →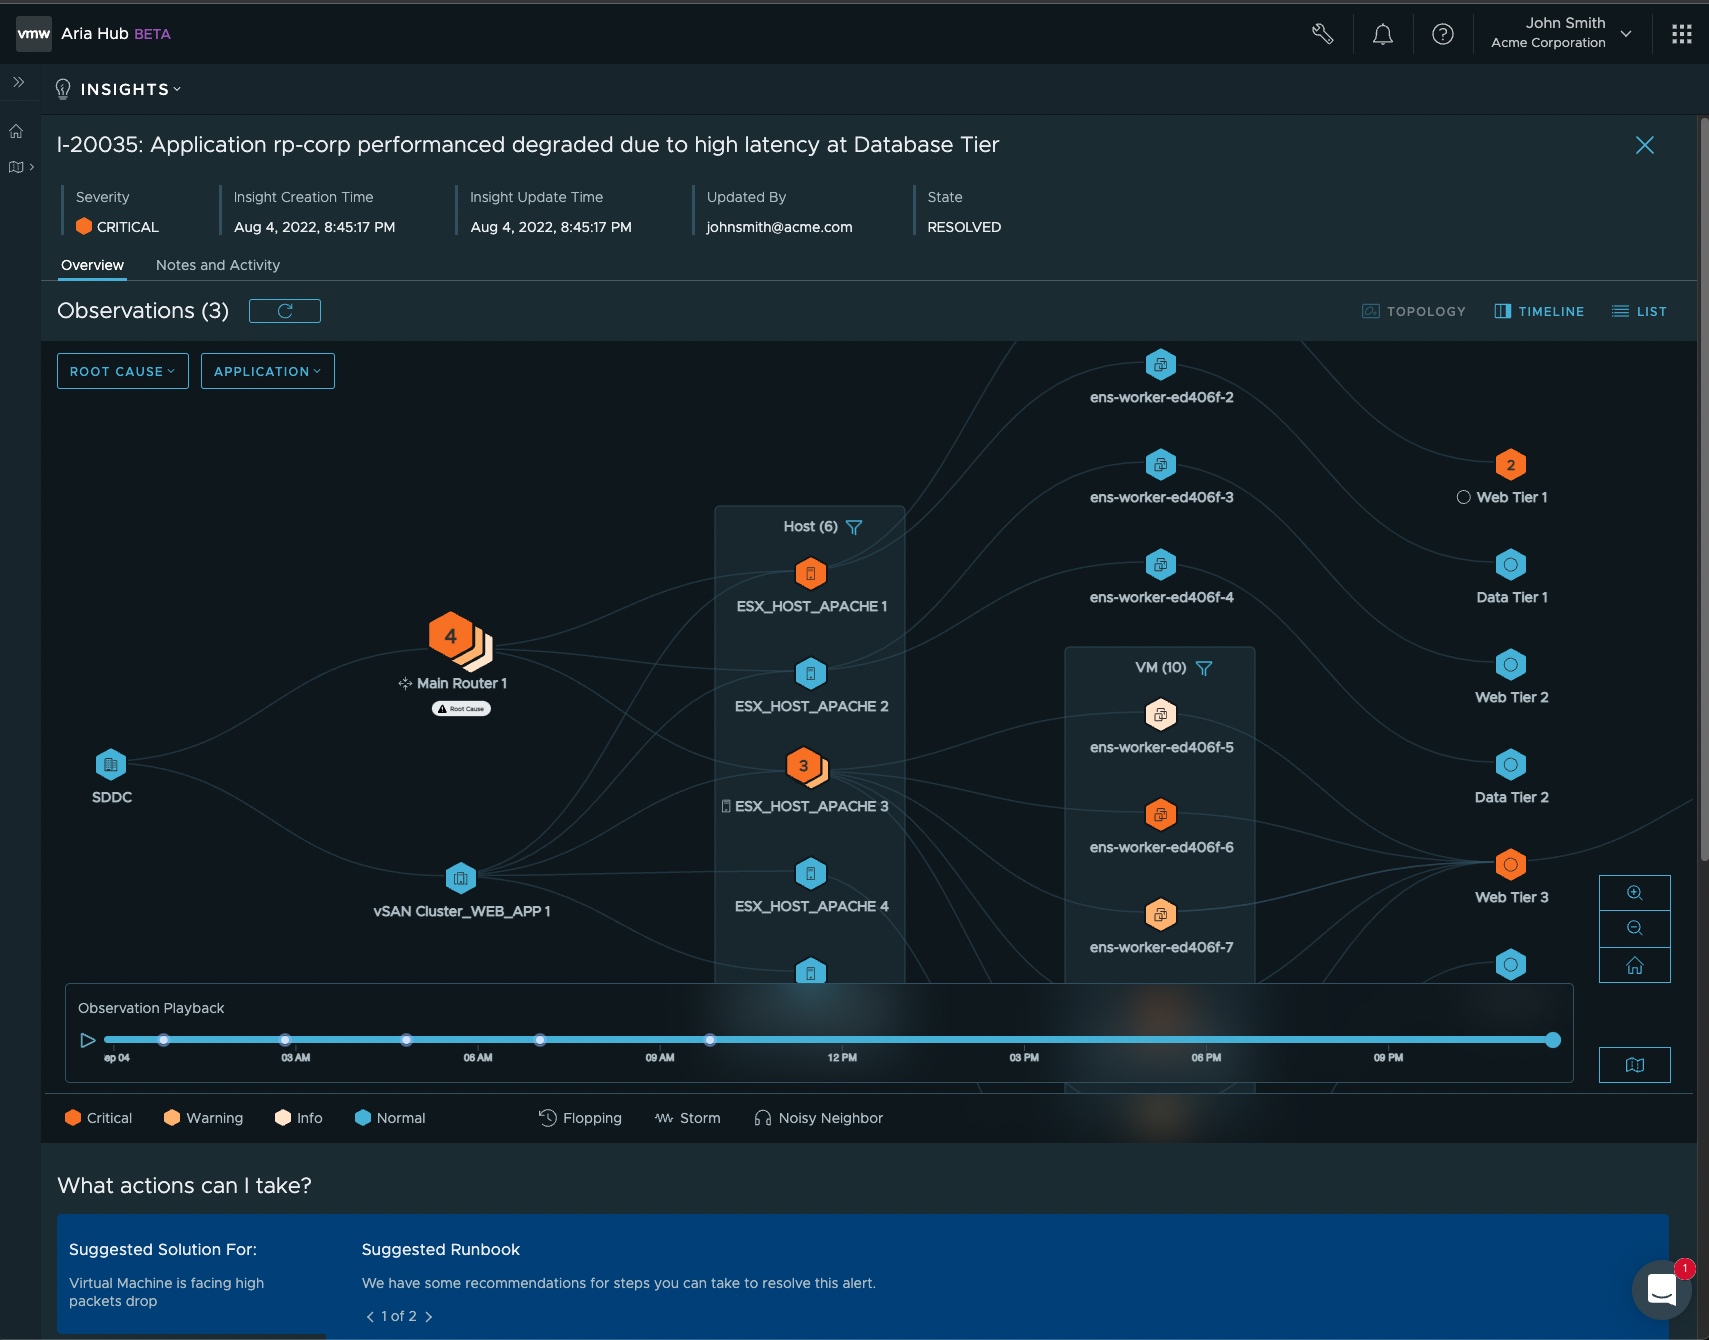
Aria Insights
Intelligent event management leveraging AI/ML to highlight actionable insights
Learn more →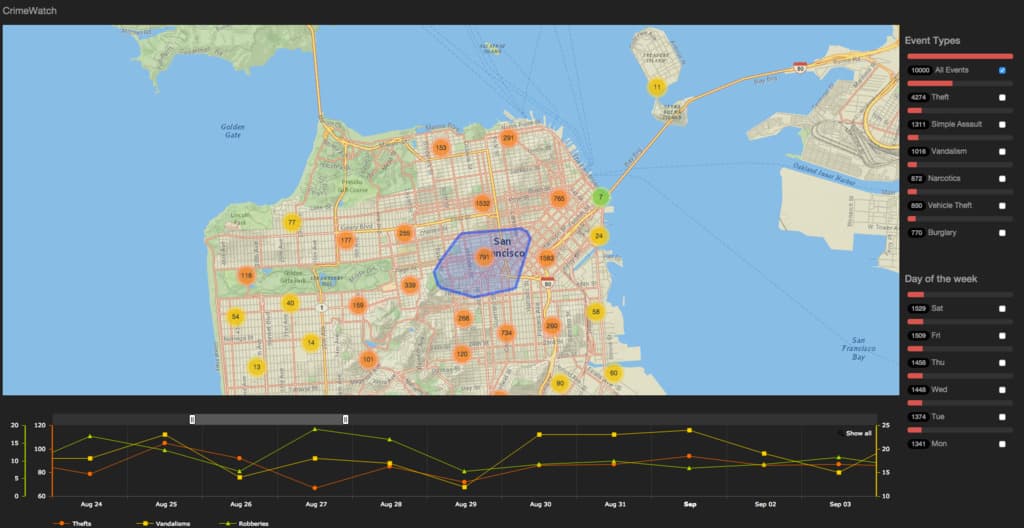
Crime Watch
Crime Watch identified what, where, and when crimes are occurring through maps, histograms, and charts
Learn more →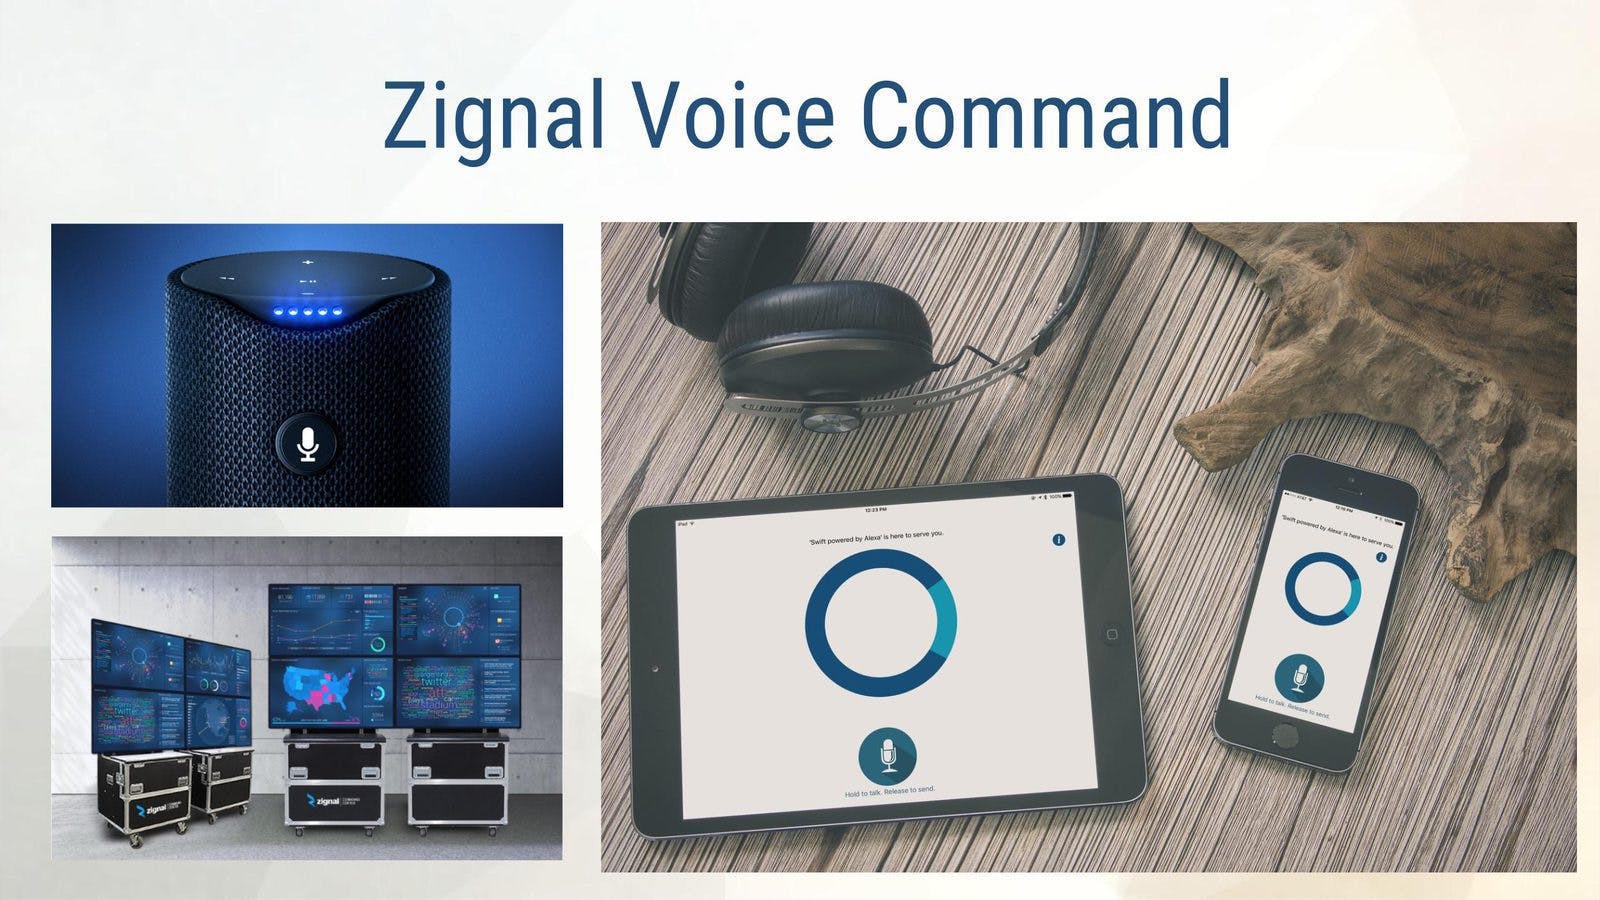
Zignal Voice
Zignal Voice provided bi-directional hands free voice control using Alexa hardware, phones, tablets, or web browsers
Learn more →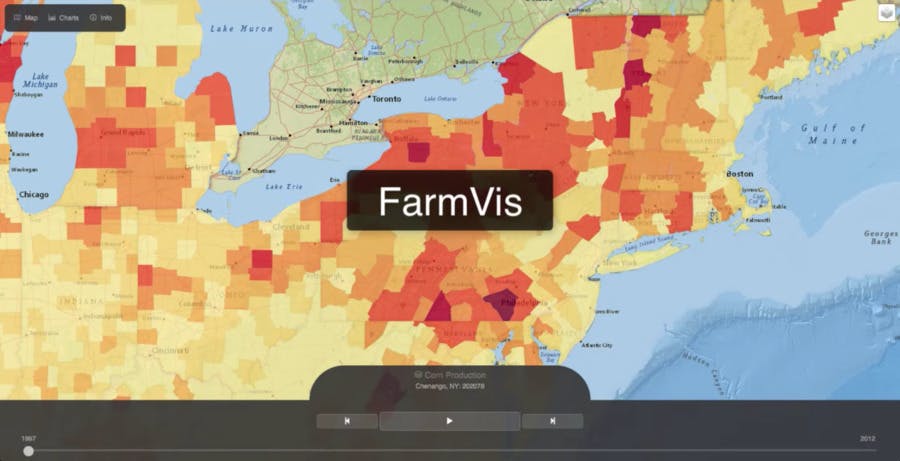
FarmVis
FarmVis aggregated data to provide actionable information and hopefully create a a sustainable U.S. food system during a time of climate change and extreme weather patterns.
Learn more →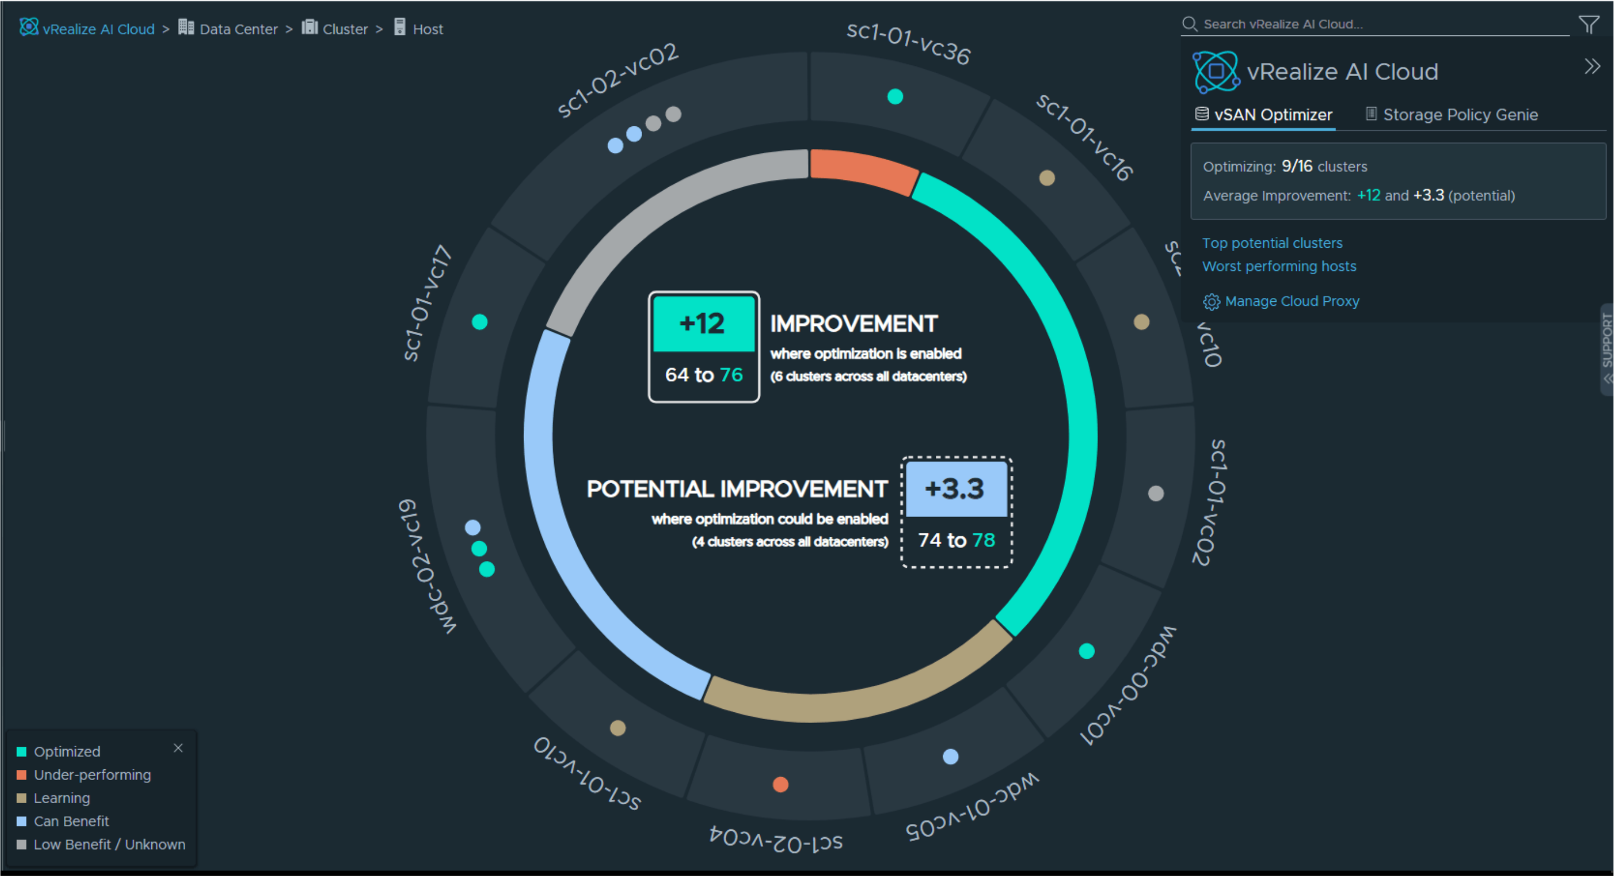
vRealize AI
The self driving data center. I worked on the UI to visualize the impact of AI and machine learning on optimizing performance
Learn more →
Health Track
Health Track won first place at HealtHack DC by integrating 4 FDA data-sets using Twilio and Sendgrid to demonstrate functionality on Google Glass, iPhone, iPad, Android, and the web
Learn more →