- Published on
Crime Watch
Crime Watch was created in ~20 hours as part of a homework assignment that used to be a requirement to join Ringtail Design. The homework described a San Francisco Police Chief needing to identify patterns, trends, and outliers from a 10,000 entity KML file so she/he can plan police coverage for the upcoming months. I implemented a responsive web application and created some reveal.js slides to present to the hiring team.
The Solution
An application was created to answer 3 major questions
- What crimes are occurring?
- Where are they occurring?
- When are crimes occurring?
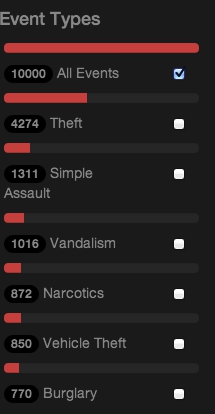
Histogram
A histogram identifies the top types of crimes:
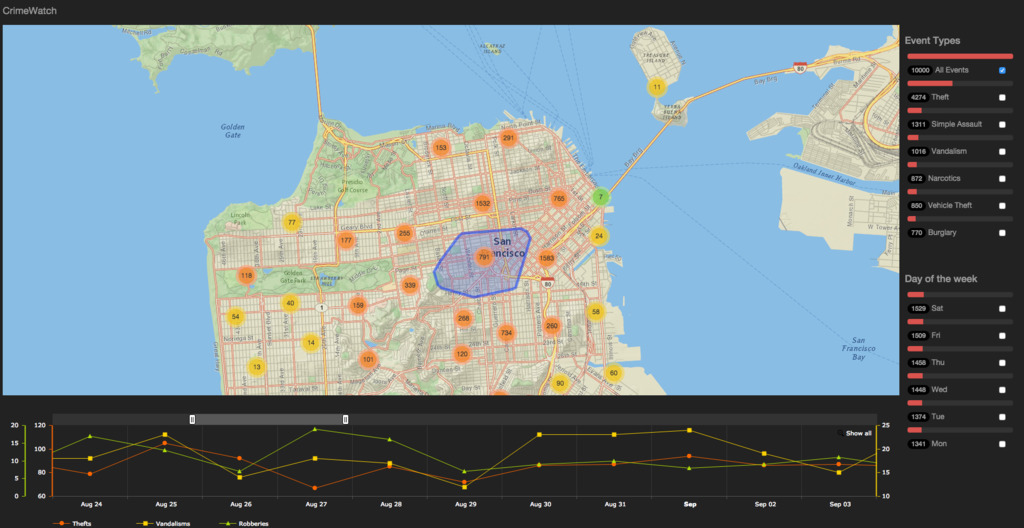
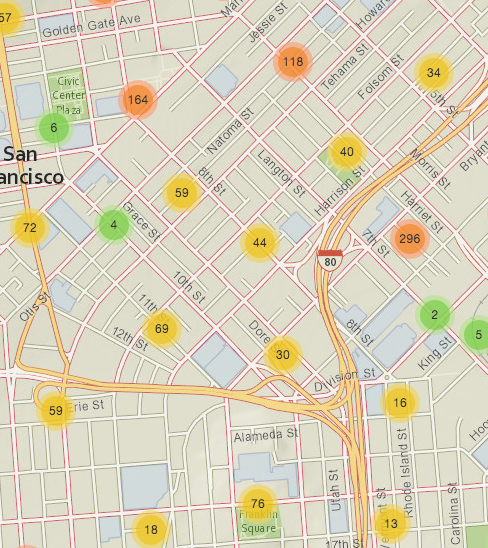
Geospatial Clustering
Numbered clustering identifies the areas with the most crime, which is highly concentrated in the courthouse area:
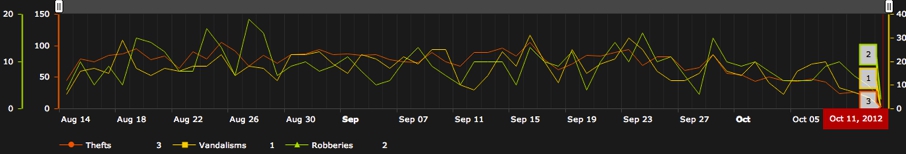
Timeline
A timeline identifies trends in crimes, most notably a peak in the middle of August and a slow decline leading into October.
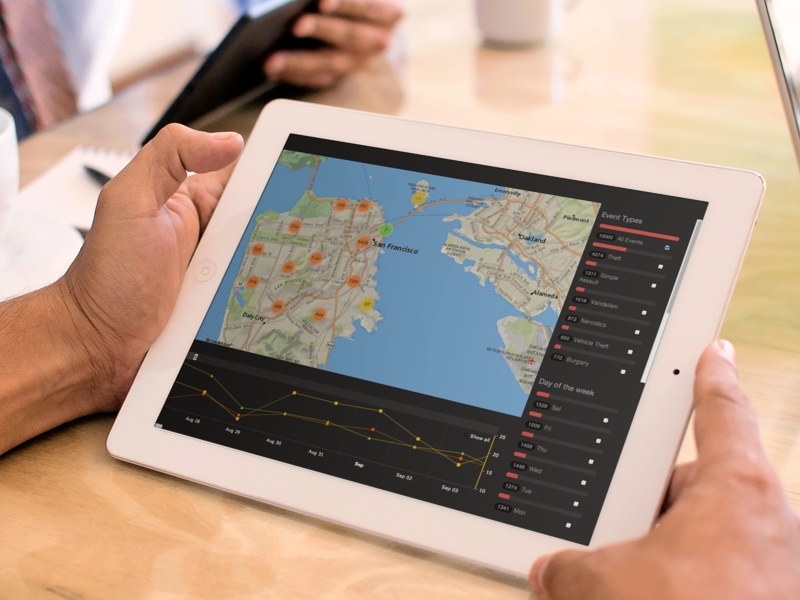
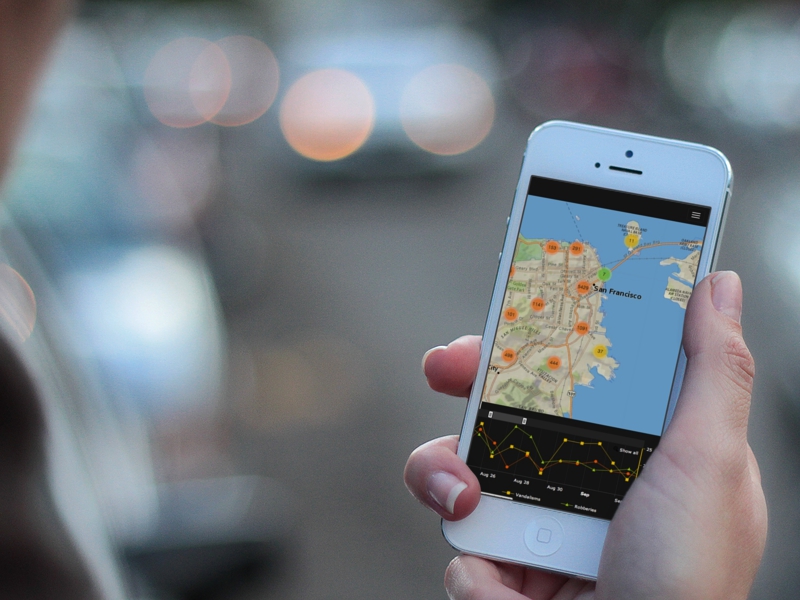
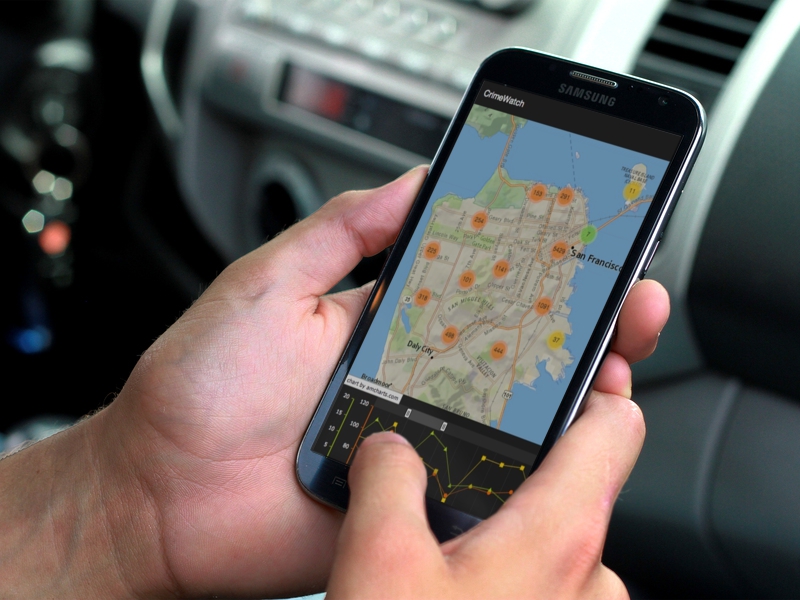
Mobile and Tablet Support
Since the app was responsive, it was fairly easy to port it as hybrid iOS and Android apps. For the demo, I brought along my iPhone, iPad, and an Android phone.